


Engagement rate: followers vs impressions, with worked examples
A 3.8% follower-based rate and a 1.9% impression-based rate can describe the same post. Learn why the denominator matters.
One post, two valid calculations
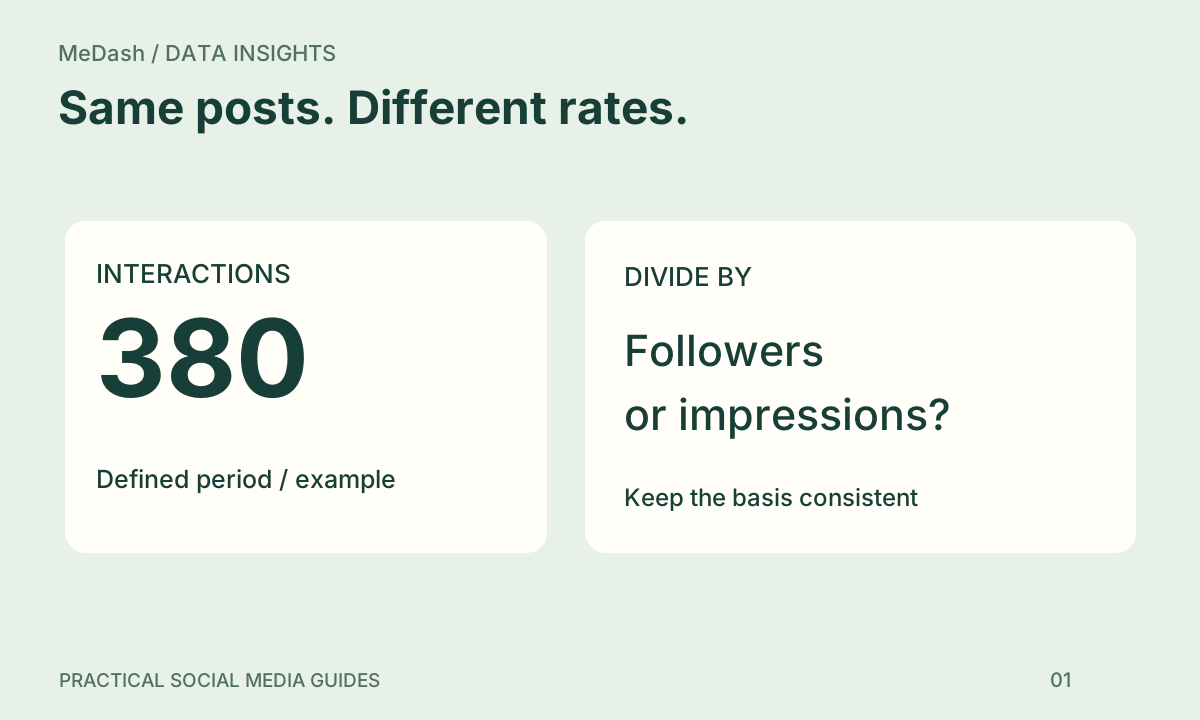
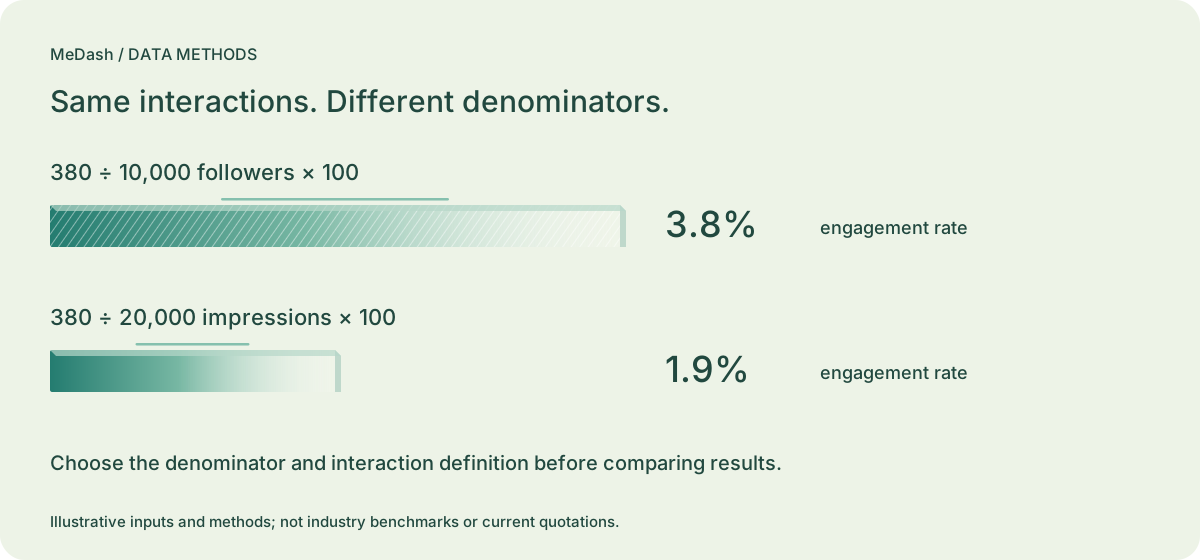
Suppose a post receives 320 likes, 42 comments and 18 shares. It generates 380 interactions. The account has 10,000 followers, and the post records 20,000 impressions.
| Basis | Calculation | Result |
|---|---|---|
| Followers | 380 ÷ 10,000 × 100 | 3.8% |
| Impressions | 380 ÷ 20,000 × 100 | 1.9% |
These are illustrative inputs, not an industry benchmark. Both calculations are correct; they answer different questions.
Use a consistent interaction definition
Some reports include saves, clicks or reactions. Others count only likes, comments and shares. Record exactly which actions enter your numerator. Reach counts unique people under the provider’s definition; impressions count display events. Do not substitute one for the other without labeling the change.
Average rates or aggregate totals?
If post A has 10 interactions from 100 impressions and post B has 100 from 10,000, their rates are 10% and 1%. The simple mean is 5.5%. The aggregate rate is 110 ÷ 10,100 × 100 ≈ 1.09%. Use the mean to describe an average post and the aggregate to describe all measured impressions. Label which approach you chose.
A practical reporting checklist
- Fix the reporting period and timezone.
- Choose followers, reach or impressions as the denominator.
- Document included interactions and paid vs organic scope.
- Keep provider definitions alongside cross-network charts.
- Compare trends within the same account before generalizing.
Try the free engagement calculator using your own counts. For connected-account reporting, review MeDash analytics.